This post is a bit more developer-oriented than usual. It describes a powerful python source code tracing system recently introduced in WALT.
You can get more details by looking at the new developer documentation we introduced with WALT 9.0, more precisely at this page.
Purpose of Trackexec
Since WALT 9.0, the server component now includes a powerful tracing system called Trackexec. It is useful for replaying a previous run of the python code, for post-mortem analysis, or for analyzing code paths.
Trackexec is most useful to analyze and triage unexpected behaviors. For instance, using an old WALT testbed at Schneider Electric we have observed that Raspberry Pi 3B boards sometimes get stuck after a reboot. This occurred approximately once every 2000 reboots. When rebooting the 100 nodes of the testbed at once, it became quite frequent. Since this older testbed was lacking PoE (Power-over-ethernet), WALT had no means to force a node reboot, so the whole process was blocked. Using Trackexec helped to ensure WALT software was not the cause of the issue, and we concluded it was a hardware or firmware problem on the Raspberry Pi boards. Shortly after that, this older testbed was replaced by two newer WALT testbeds, both equipped with PoE, and they have proven to be very reliable.1
Trackexec is also useful for identifying performance improvement opportunities in the python source code.
“Replaying” WALT software runs
Once Trackexec is enabled (explained later), we can “replay” the last run of the main server process by running:
$ walt-server-trackexec-replay /var/log/walt/trackexec/latest/server-main
This displays an interactive interface:
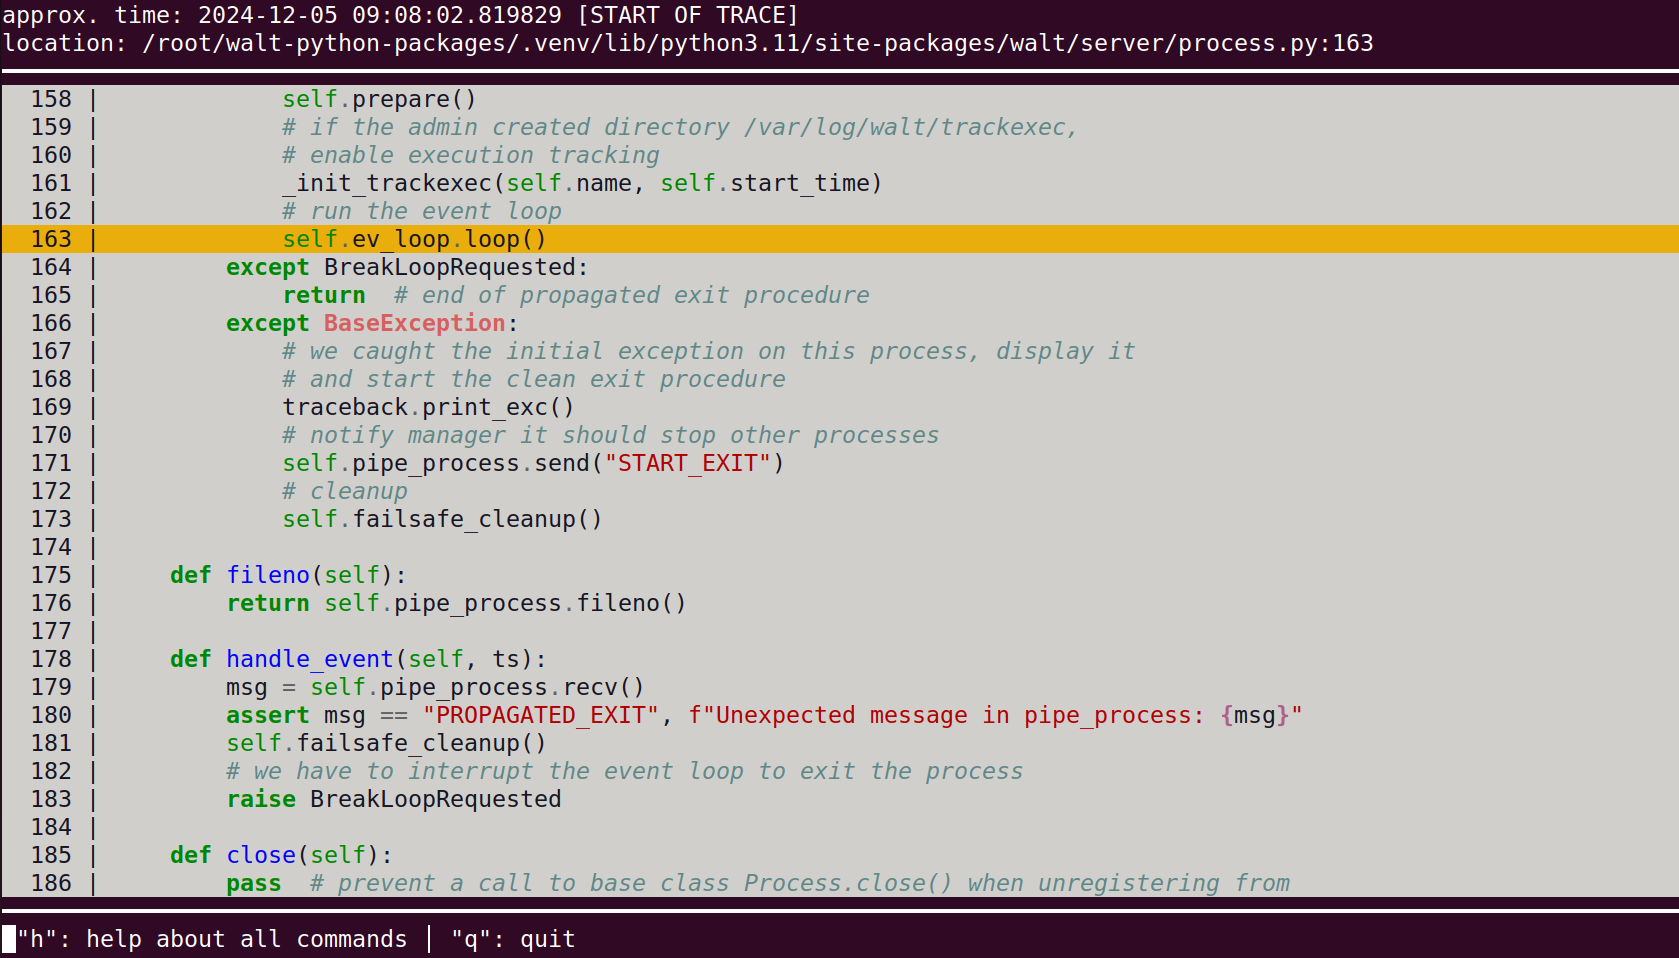
This interface allows to navigate through the execution trace, similarly to a debugger: for instance, you can type n for next, s for step (i.e., enter a function call), etc.
You can also set a “breakpoint” on a specific line using b <line-number>, then type c for continue, and the tool will fast-forward to the next occurrence of this source code line in the execution trace.
Important note: this interface really looks like a debugger, but always keep in mind that we are just exploring an execution trace, not running the program. What happens on the interface (such as reaching a “breakpoint”) has absolutely no impact.
The interface also allows to jump in time, a very useful feature for instance when exploring what happened at a given log timestamp.
Typing h displays the help screen explaining these commands:
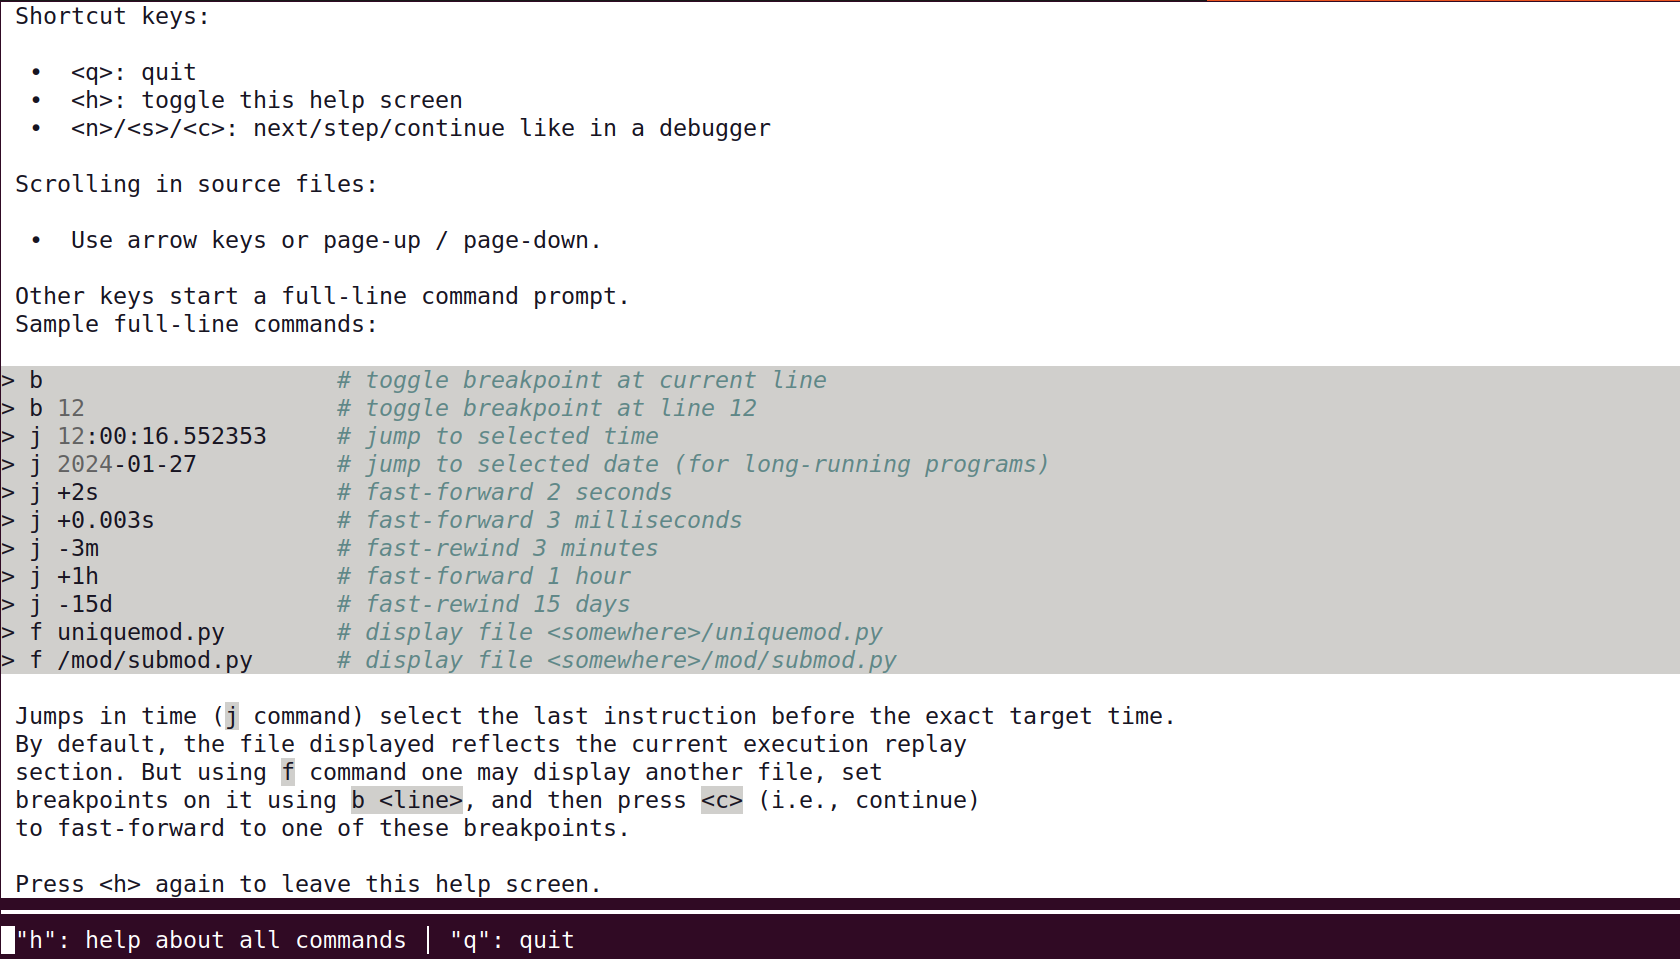
Type h again to return to the main screen, and q to quit.
Analysing WALT software runs
Another Trackexec tool called walt-server-trackexec-analyse is able to analyse a run regarding the time it took to execute each and every line of code, in order to list “hot points”:
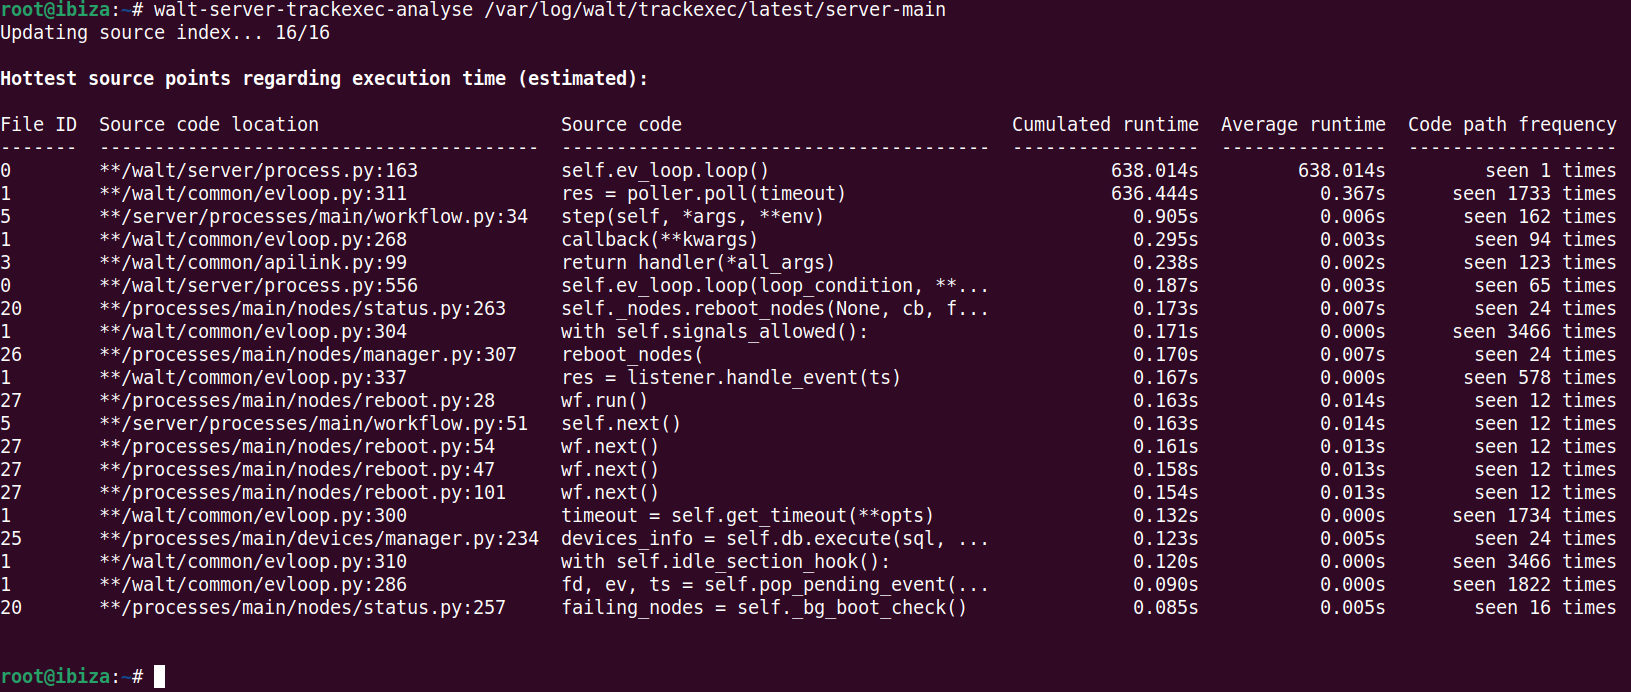
The tool has options to increase the number of output lines or select the column used for sorting.
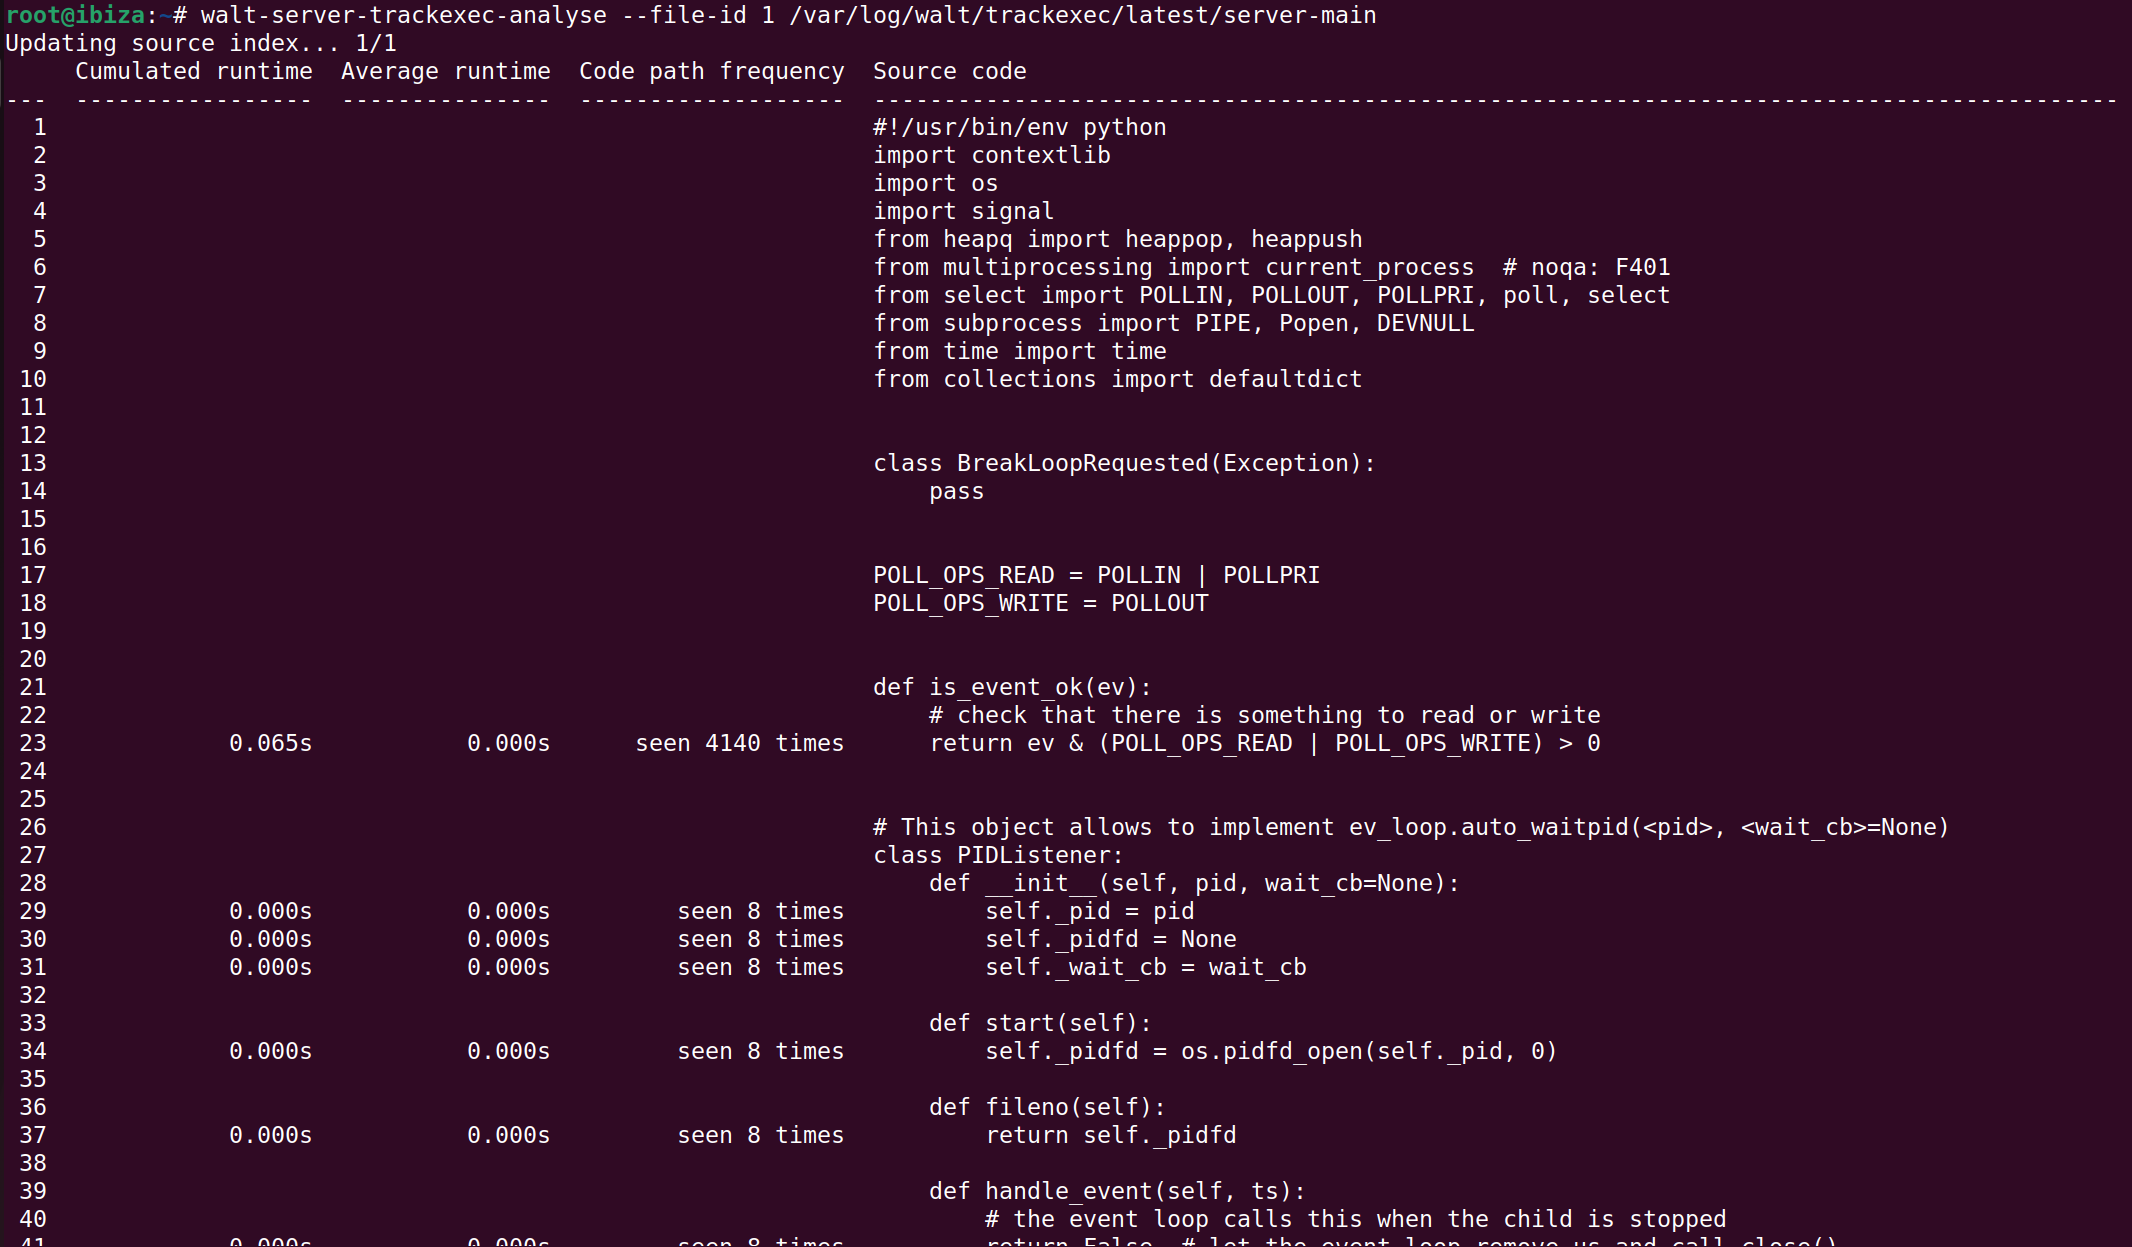
Another option called --file-id allows to analyse a specific source file. File IDs are given by the first column of the previous command. When option --file-id is specified, the selected source file is dumped with information about code frequency and timing of each line:
Enabling Trackexec
In order to enable Trackexec, just create the directory /var/log/walt/trackexec and then restart the main process:
$ mkdir -p /var/log/walt/trackexec
$ systemctl restart walt-server
This will start recording the runs of the 4 main processes: server-main, server-db, server-blocking and server-hub, each one in a dedicated directory at /var/log/walt/trackexec/<date>/<process>.
A symlink called latest is also updated to always target the last <date> entry.
So for instance, the trace of the last run of server-main is at /var/log/walt/trackexec/latest/server-main.
Actually, if walt-server.service is currently running, the latest symlink targets this current run. Using Trackexec tools on the current run is allowed, and it will work as usual, except that the end of the trace will correspond to the time the tool was started. Also, keep in mind that we are just exploring an execution trace, so for instance “setting a breakpoint” has no impact on the server software currently running.
Note that execution traces are not human-readable. They are just useful with the tools described above.
Performance, limits and impact
We designed Trackexec with the goal to make it viable on a production system, not only for development. This means that:
- CPU usage increase when enabling Trackexec should not be significant.
- Disk space needed for
/var/log/walt/trackexecshould not exceed a few tens of GB, even after years of usage. - System responsiveness, such as the time for the server to respond to
walt node showshould not be significantly increased.
Achieving this goal implied the following:
- Unlike other tools making use of python code tracing primitives, Trackexec only records the execution path, and not any other data (such as the environment variables at each line) because the performance impact would be too high on production software.
- Only WALT server code is recorded, not the code of dependencies.
- The tracing starts after the software initialization phase only, so we don’t trace python module imports, etc.
- The traces are stored on disk with buffering, so if analysing the process currently running you may not get the very last executed lines.
- Timestamps are recorded sparsely in the trace, so the timestamp of each line of source code is approximate.
- Some of the existing code has been optimized to avoid nested python loops (e.g., by using
numpy).
Note that Trackexec was designed for WALT, an I/O-bound program. Reusing Trackexec code for a CPU-bound python program would probably have a too large performance impact. Check-out py-spy as an alternative in this case. It is a sampling profiler so the exact code path will not be recorded, but for general code profiling it may be a good option.
Some problems are very hard to reproduce with a real debugger, for instance those involving concurrent asynchronous routines, because breakpoints break the concurrent behaviour. By working on a trace of the process, Trackexec can be very useful in understanding such a problem.
Last words
For now Trackexec is part of the main source code repository of WALT, because it is easier for us to maintain a single project; but if you would like to reuse this module for your own python project, feel free to contact us.
Thanks to Jérémie Finiel for proofreading. If you have questions, we can answer you on the mailing list.
-
The newer testbeds at Schneider Electric are made of Raspberry Pi 4B boards. Unfortunately, we could observe that the infrequent hanging problem was still there with these new Raspberry Pi 4B boards. However, by sending appropriate requests to PoE switches, WALT was now able to automatically power-cycle any board that was failing to boot before
boot.timeoutseconds. Since then, these two new testbeds have proven to be very reliable. ↩︎